C A R B O N D I O X I D E
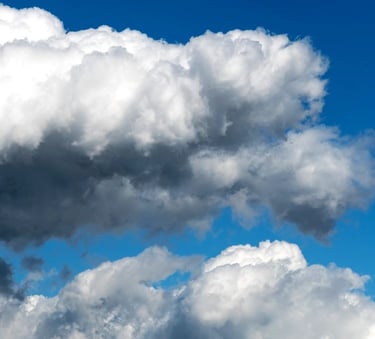
Homeo sapiens used to live on a Goldilocks planet. Not too hot and not too cold with an average temperature of 13.73°C. Of course, the poles were a little chilly and the tropics rather hot, but the 10 million species of life on the planet reckoned it was perfect. Now carbon dioxide (CO2) is changing all that. By 2023, the Earth’s average surface temperature had risen to 15.08°C, 1.35°C warmer than the pre-industrial average. 2024 smashed that record - it was 1.54°C warmer.

To understand what’s driving this upward trend, we have to look closely at the composition of the atmosphere. The lowest layer, the troposphere, is around 7.5 miles thick. Most of it is made up of nitrogen (78%) and oxygen (21%) while the remaining 1% is a hotch potch of Argon (Ar), carbon dioxide, Neon (Ne), Helium (He), methane (CH4) and others.
It’s a great combo of gases. Lots of inert nitrogen to prevent the Earth spontaneously combusting to a crisp. Enough oxygen for the life-giving process of aerobic respiration. And then there’s a tiny smidgen of carbon dioxide and methane together with variable amounts of water vapour that trap long wave infrared radiation - heat. Without that smidgen, the Earth’s average temperature would be -18°C. In pre-industrial times, the concentration of CO2 in the troposphere was just 0.028%. Unsurprisingly, no one took the slightest interest in it.
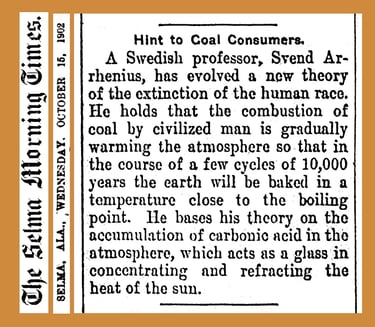
Until, that is, in 1895 when Svante Arrhenius, a Swedish scientist, asked the question: “Is the mean temperature of the ground in any way influenced by the presence of the heat-absorbing gases in the atmosphere?” He wasn’t a climatologist or a geophysicist. Instead he was a chemist and in 1905, he won the Nobel prize for chemistry. His climate work was just a sideline, a hobby, which relied heavily on the experiments and observations of other scientists. He proposed that trace gases in the atmosphere like CO2 could affect the Earth’s heat budget. As if that wasn’t prophetic enough, he went on to calculate that a 2.5 to 3-fold increase in CO2 would result in an 8 or 9°Celsius rise in the Earth’s Arctic regions. Of course no-one paid any attention to this rather far-fetched notion. Neither did the scientific world get particularly excited by a newspaper article that appeared in the Selma (Alabama) Morning Times on October 15, 1902. (Fig. 2)
The 10 most recent years have been the 10 warmest on record.


1900
2024
Wannapik
Wannapik
Figure 2: By The Selma Morning Times (1902)

Figure 1: Composition of the Earth's troposphere.
Life of Riley, CC BY-SA 3.0
Arrhenius was ignored for the best part of a century. The notion that burning coal could affect something as vast as the Earth’s atmosphere was deemed absurd. Extinction of the human race? Get a grip, Svante.
In 1938 Guy Callendar, a steam engineer and part-time climatologist, wrote:
And seek he did, eventually compiling historical data on global temperature and CO2 levels. On a graph, they correlated perfectly. One goes up, so does the other. But cause and effect? He certainly thought so and presented his findings to a panel of eminent climate scientists at the Royal Meteorological Society. Their response to the amateur Callendar was oh-so-predictable. How on earth could a gas comprising no more than 0.03% of the atmosphere possibly affect global temperature? Don’t meddle in matters of which you have no understanding, they told him.
Then, half a century later in 1988, James Hansen, director of the NASA Goddard Institute for Space Studies in New York City, stood up in front of a US Senate Climate Hearing and proclaimed:
“As man is now changing the composition of the atmosphere at a rate which must be very exceptional on the geological time-scale,” he wrote, “it is natural to seek for the probable effects of such a change.”
Among those who spoke in support of Hansen was Environmental Defense Fund Senior Scientist Dr. Michael Oppenheimer who highlighted the immediacy of the climate crisis, stating,
“The Earth is warmer in 1988 than at any time in the history of instrumental measurements. With 99 percent confidence we can state that the warming during this time period is a real warming trend. Carbon dioxide is changing our climate now.”


“In my personal opinion, greenhouse warming presents the most important global challenge of the next few decades, on a par with defense, disarmament, and economic issues.”
James Hansen
Today, the irony of that warning from the United States is louder than a sonic boom.
Let’s get down to CO2 business. I strongly recommend putting a link to the website https://www.co2.earth/daily-co2 on your device and checking it weekly. It is dedicated to the daily monitoring of global atmospheric CO2 concentrations, data generated by the Global Monitoring Laboratory run by the National Oceanic and Atmospheric Administration (NOAA), a wing of the US Department of Commerce.
In every major square in every city and town of every country worldwide there should be a giant screen showing the current atmospheric CO2 concentration. Only then will Homo sapiens sit up and take note. Only then will CO2 concentration become a daily topic of conversation. Only then will children start asking their parents what they’re doing to slow the increase because right now, CO2 concentration isn’t simply increasing, the rate at which it’s doing so is increasing. Yep, it beggars belief. 37 years after Hansen told the world “Carbon dioxide is changing our climate now,” CO2 levels are rising faster than at any point in the last 50,000 years.
Time for some data.
Figure 3


Figure 4
Most of this data comes from ice core samples, the oldest of which was drilled by the European Project for Ice Coring in Antarctica. Their core dated back 800,000 years before present and gave detailed information about air temperatures and CO2 concentrations over this vast period of time. In 1958, yet another visionary US scientist Charles Keeling began measuring CO2 concentrations from an observatory situated at 3,397 meters on Mauna Loa, a volcano in Hawaii. He used a device which for the first time gave reliable and accurate results taken from atmospheric air that was well mixed at altitude and distant from any sources of pollution that might have interfered with readings. These results, plotted out, give us the Keeling Curve. (Fig. 6)


Figure 5: Charles Keeling receiving the Medal of Science from President Bush
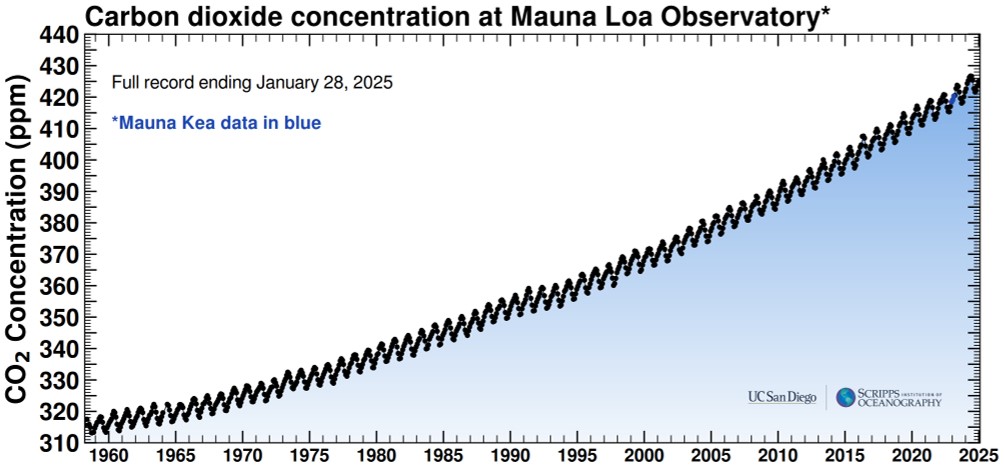

Fig. 7 below gives a clearer picture of the last two years on the Keeling Curve. I have added red lines to enable comparison of June 1st 2023 and June 1st 2024. If a similar increase is registered in 2025, then by June 1st this year, the CO2 concentration could reach almost 430ppm.

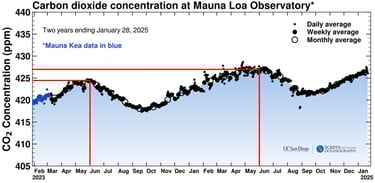
Figure 7
Each year, the concentration of CO2 in the atmosphere fluctuates with seasonal variation, up in Oct - May, down in May - Sept. The larger expanse of vegetation in the Northern Hemisphere begins photosynthesising and taking up CO2 in May, reducing the overall concentration. This ceases in October when much of the vegetative mass dies and decomposes to release CO2 back into the atmosphere.
Back once again to my childhood, this time a 4-year-old in 1960 running amok outdoors, breathing in an atmosphere with just 317ppm. That was already a huge increase on the pre-industrial figure of 280ppm. A pupil in a class I was teaching once challenged my assertion that an increase of just a few parts per million could possibly be described as ‘huge’. In response, I asked her to work out the percentage increase from 280ppm to 317ppm. 13%. She still wasn't that impressed. What if I asked her the same question today. 280ppm to 428ppm (March 2025). 52.9% increase!
Don’t dismiss the Keeling Curve. Whether Homo sapiens survives into the next century depends on their ability to flatten it, and flatten it quickly.
But wait! Look back at the curve. Is it your imagination or is it getting steeper? Is the rate at which CO2 is being added to the atmosphere increasing?
The concentration of the principle greenhouse gas in 2025 has increased by half as much again as it was in the 19th Century.
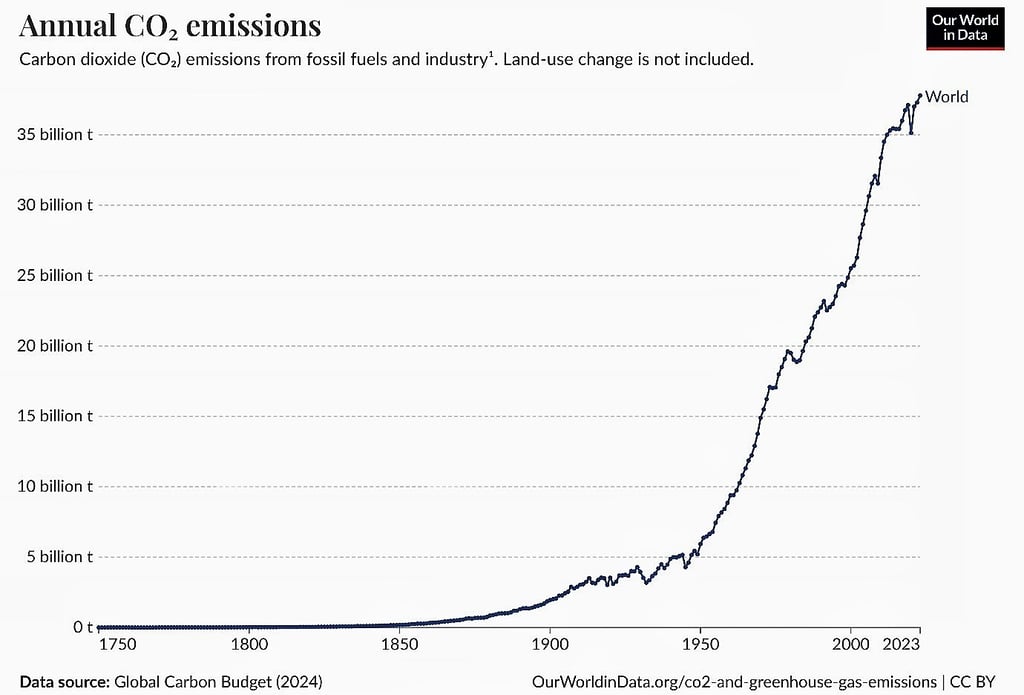
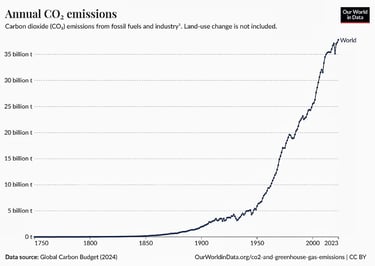
Figure 8
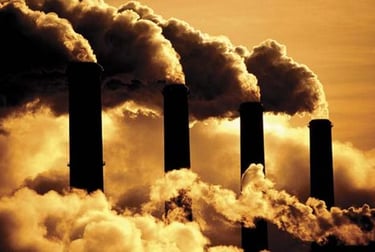
You might be forgiven for thinking that Figure 4 displays the cumulative CO2 emitted by human activity into the atmosphere. If only. Instead, it shows the increase in CO2 emissions year on year with a brief dip in 2020 during the COVID pandemic. It is no wonder, therefore, that atmospheric levels of CO2 are increasing. In June 1988 when Charles Hansen warned all of America that carbon dioxide was changing the climate, the annual increase in atmospheric CO2 was 2.30ppm. In June 2024, the annual increase was 3.23ppm. Different months in a year will yield different increases. Taking a mean of all the days in each month will yield different increases. But every which way, it’s an increase, and every which way, that increase is getting bigger. And just as Arrhenius predicted back in 1902, fossil fuels are mainly responsible.
Deforestation also releases vast stores of CO2 and a felled tree can no longer remove CO2 from the air through photosynthesis. Deforestation contributes around 12% of all anthropogenic (human-caused) CO2 emissions. Click here for more information.
The last of the major CO2 contributors is the cement industry whose chemical processes and burning fuel to power those processes releases 8% of all CO2 emissions. Click here for more information.
Finally, it’s time to ask how different countries compare on CO2 emissions. Industrialised countries represent just 20 per cent of the world's population but account for 80 per cent of cumulative CO2 emissions since the beginning of the industrial revolution. This can be largely summarised in the following map (emissions in million tonnes).
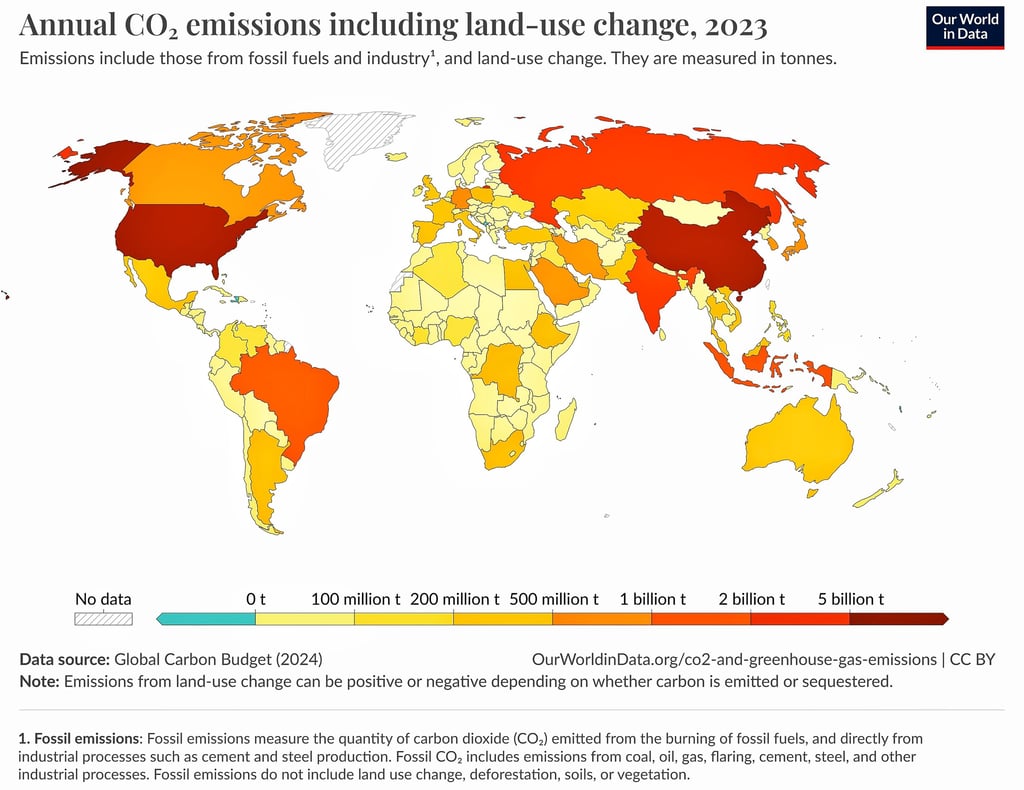
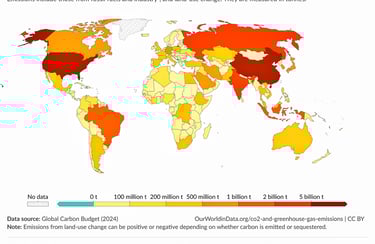
Figure 9
Of course, this does not take into account population size. It is not surprising to see that India, for example, now the most populated nation on the planet, has one of the highest annual CO2 emissions. A fairer way of comparing emissions is per capita, i.e. per person. (emissions in tonnes.)
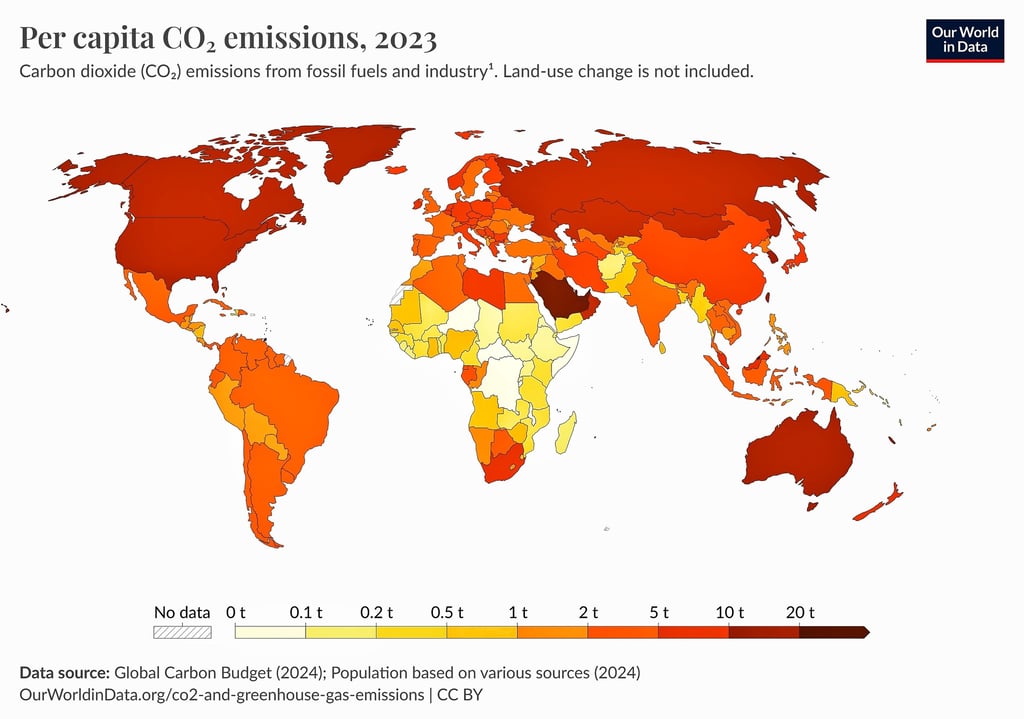
Figure 10
In India, average CO2 emissions per person is now 2.1 tonnes. Compared to middle-income countries, this is low. As Hannah Ritchie et al., point out in the accompanying article, in low and middle-income countries, CO2 emissions and incomes have become tightly coupled. It is as if the only route to higher incomes is by:
burning more fossil fuels to generate more electricity;
building more and faster transport links;
removing forests to create more space for agriculture;
creating larger urban concrete infra-structure to cope with the influx of people seeking higher-wage employment.
The following table (2022) serves to illustrate the point.
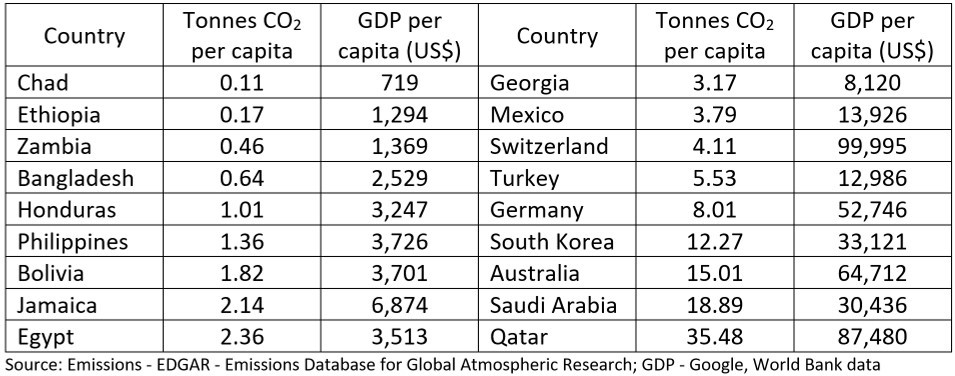
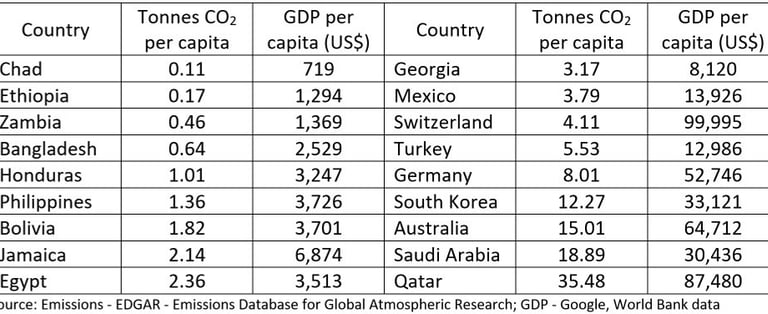
Table 1
Critics will argue that just because there is correlation between the two variables does not mean that one causes the other. The vast bulk of evidence does suggest cause and effect. Living in a developed nation, how do I choose to spend my income? A house with gas central heating and multifuel (wood and coal) stoves. A petrol-driven car. Foreign travel by air. Shopping online that is delivered to my door. The carbon-emissions list is endless. The responsibility falls on those of us in developed countries with high per capita emissions to reduce our emissions quickly, and so ‘make space’ in the carbon budget for poorer countries to grow. There is little doubt that outside of sub-Saharan Africa, poorer countries are growing their economies. But if affluence and CO2 emissions are padlocked together, what chance is there of richer countries cutting their CO2 emissions back both substantially and rapidly? Two key words. Substantially and rapidly. We’ll tackle this issue in the mitigation section.
A word of warning when interpreting the data in Table 1. Switzerland seems to be bucking the trend of high GDP with high emissions. Instead, its highly productive economy generates great wealth for its citizens while apparently keeping its per capita CO2 emissions on a par with middle to low income countries. Don’t be fooled. Per capita CO2 emissions don’t take into account the emissions from goods which a country imports or exports. Karine Siegwart, deputy director of the Swiss Federal Office for the Environment recently wrote “Due to its comparatively high consumption level, Switzerland is one of the countries with disproportionately high environmental footprints per capita.” She was right. If emissions generated via imports are counted, the footprint of each resident of Switzerland is 14 tonnes of CO2 per year. In comparison, the global average is 6 tonnes. Arguments over who ‘owns’ carbon emissions are rampant in the developed world, and never more so than at the COP summits. Carbon emission negotiators have invented ever more ingenious ways to conceal emissions behind smokescreens and thereby lower the demands made of them.