

The current state of global dependency on fossil fuels is summarised in the following charts taken from Hannah Ritchie and Pablo Rosado's ourworldindata.org. They speak for themselves.
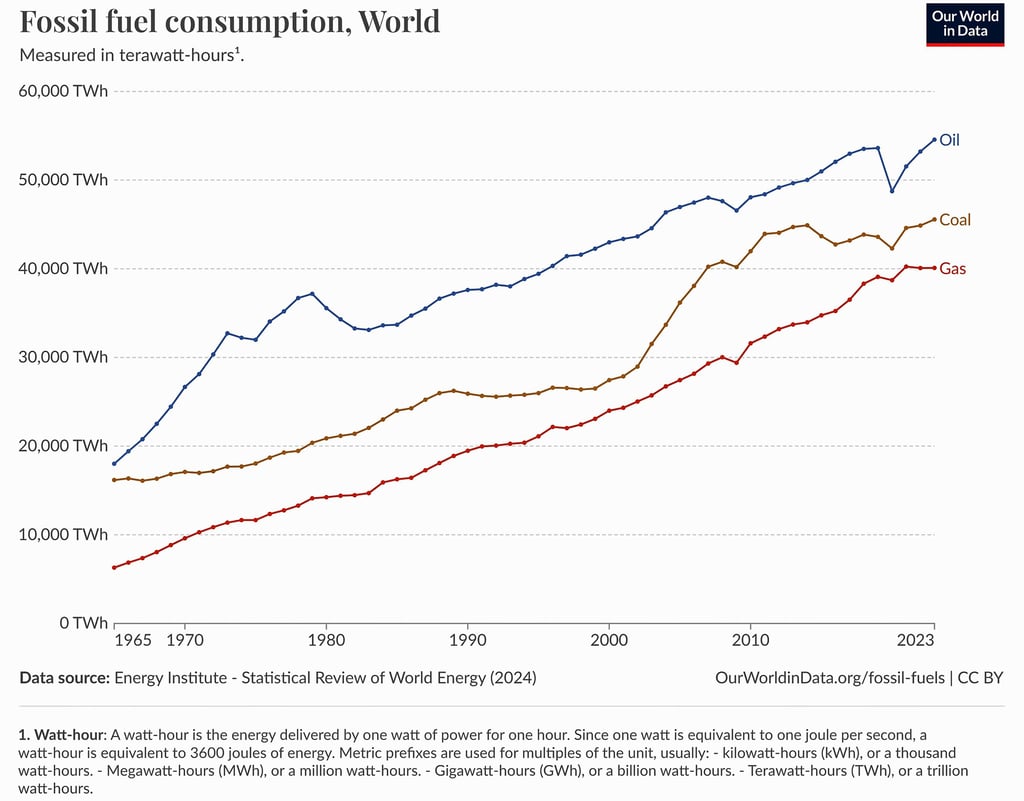
Figure 1
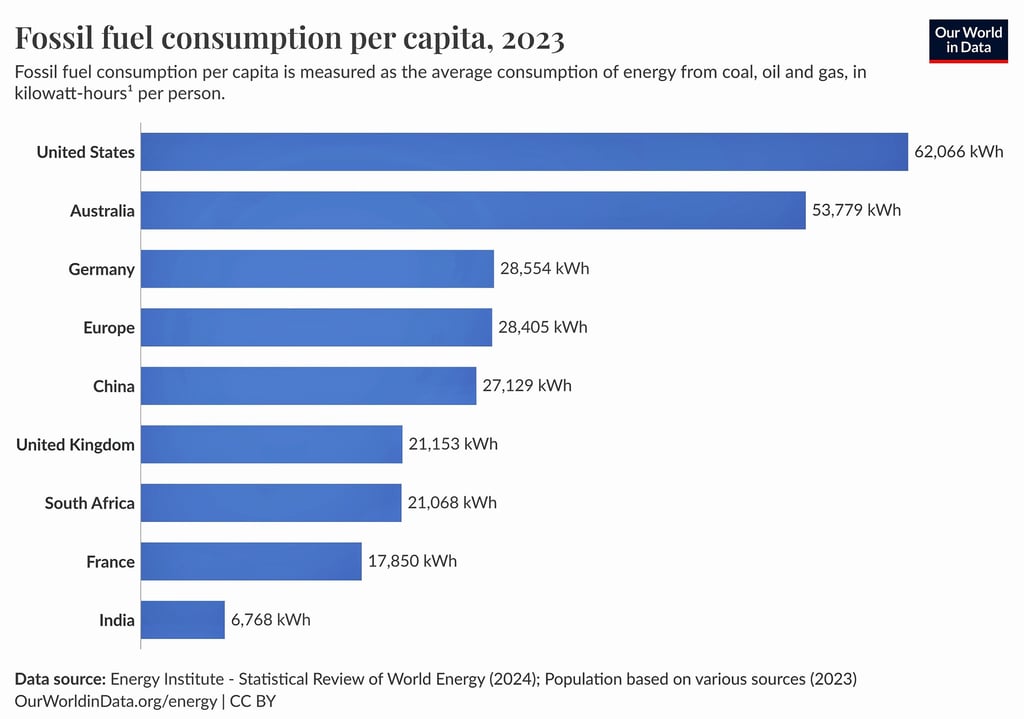


Figure 2
Figure 3
The charts above don't distinguish between coal, oil and gas. In 2023, the US obtained 60% of its electricity from fossil fuels, 43% from natural gas and16% from coal. Compare that with China whose fossil fuel figure is only slightly higher than the US (64%) but of that figure, 60% comes from coal. These differences matter since burning coal releases far more CO2 into the atmosphere than gas or oil.
Click on the links below for a more detailed discussion of global fossil fuel demand. Going up or down?


Much of the fossil fuel discussion involves greenhouse gases, in particular carbon dioxide and methane. Click on the image below for the greenhouse gas section.

Title Photo: By Adbar - Own work, CC BY-SA 3.0, https://commons.wikimedia.org/w/index.php?curid=23915753