
T E M P E R A T U R E
The world is getting warmer, of that there is no doubt. Of course there are people who deny Homo sapiens has anything to do with this warming – the Deniers. But even they can read a thermometer. NASA’s Goddard Institute of Space Studies assembles one of the world's most trusted global temperature records, using a combination of surface air temperature data acquired by tens of thousands of meteorological stations, as well as sea surface temperature data from ship- and buoy-based instruments. Historical measurements dating back to 1880 are derived from historical weather station data.
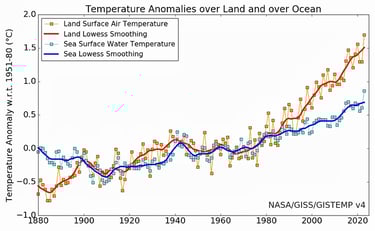
That’s a lot of thermometers and a lot of data. Graphed, it looks like this:
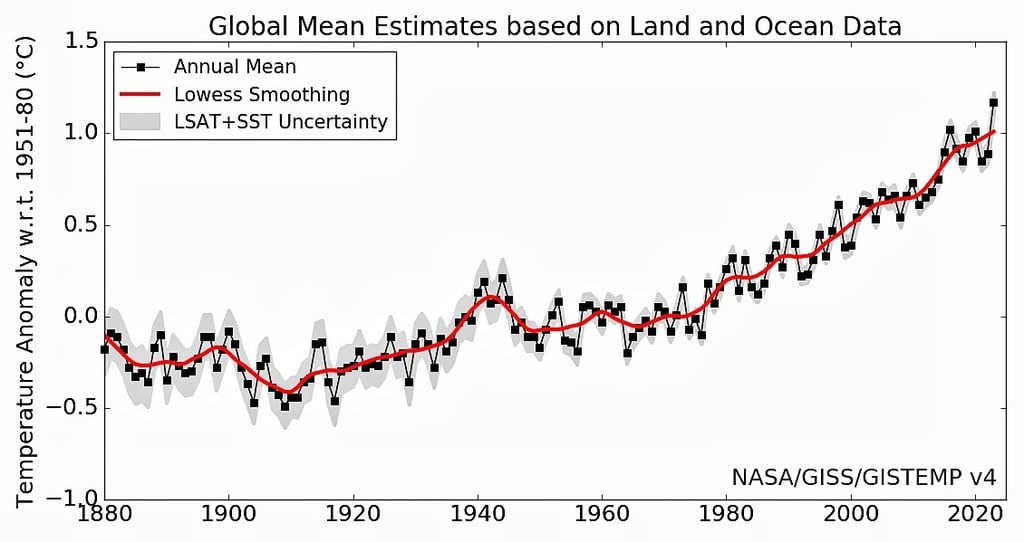
NASA and Goddard Institute for Space Studies;
Fig 1
The y-axis in Fig. 1 needs some explanation. Normally, global temperature graphs compare each year with respect to (w.r.t.) pre-industrial revolution temperatures, that is they measure the difference (anomaly) between a particular year(s) and the 1850-1900 mean temperature - around 13.7°Celsius. The so-called ‘Paris Agreement’ drawn up at the UN Climate Change Conference in 2015 set a target of...
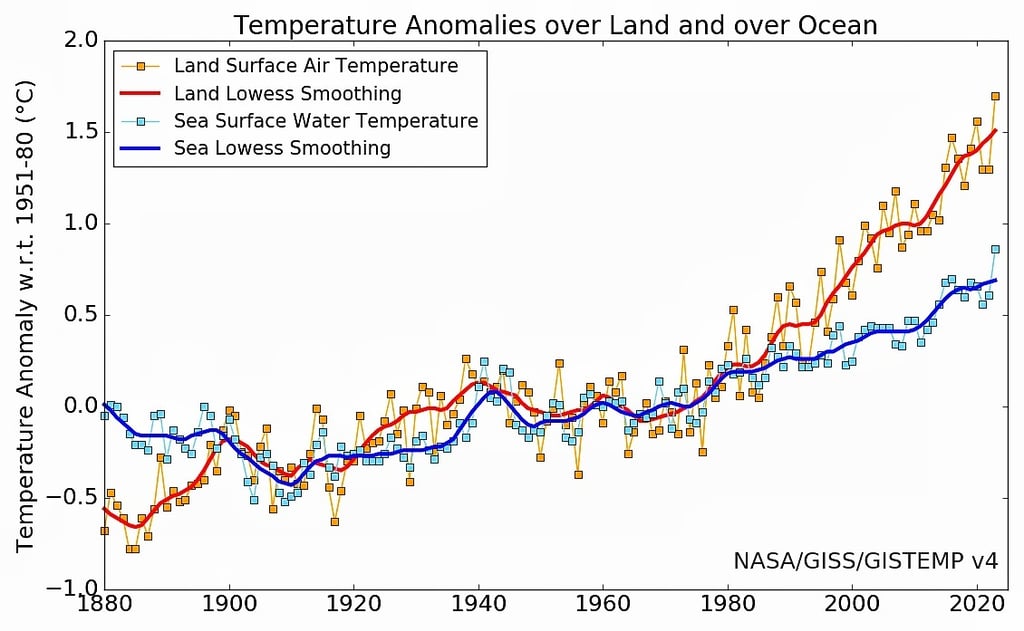
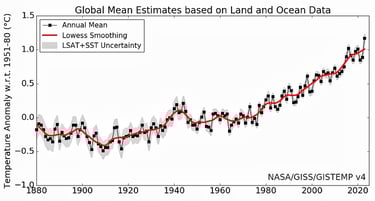
National Aeronautics and Space Administration and Goddard Institute for Space Studies; GISS Surface Temperature Analysis
Fig 2
More recently, the reference temperature has shifted to 14°C, the mean value between 1951-1980. This is both more reliable than the ‘pre-industrial’ mean and represents the period when the global temperature began its meteoric rise. Figs. 1 and 2 both use 14°C as their reference value. It is clear from Fig. 1 that the global mean estimate in 2024 (latest value) reached over 1.2°C above 14°C. 15.2°C has been breached and we are only 25 years into this century.
Fig. 2 shows mean estimate anomalies based separately on land and oceans. Two thirds of Planet Earth is ocean. It’s hard to imagine that the actions of Homo sapiens are warming the vastness of the world’s oceans. Yet they are.
...pursuing efforts “to limit the temperature increase to 1.5°C above pre-industrial levels," i.e. 1.5°C above 13.7°C = 15.2°C.
It’s no surprise that the land is heating more quickly than the oceans since it has a lower heat capacity, i.e. it’s easier to heat up. However, what happened in the north-east Atlantic in June 2023 stunned even the most hardened climate scientists.
Fig 3
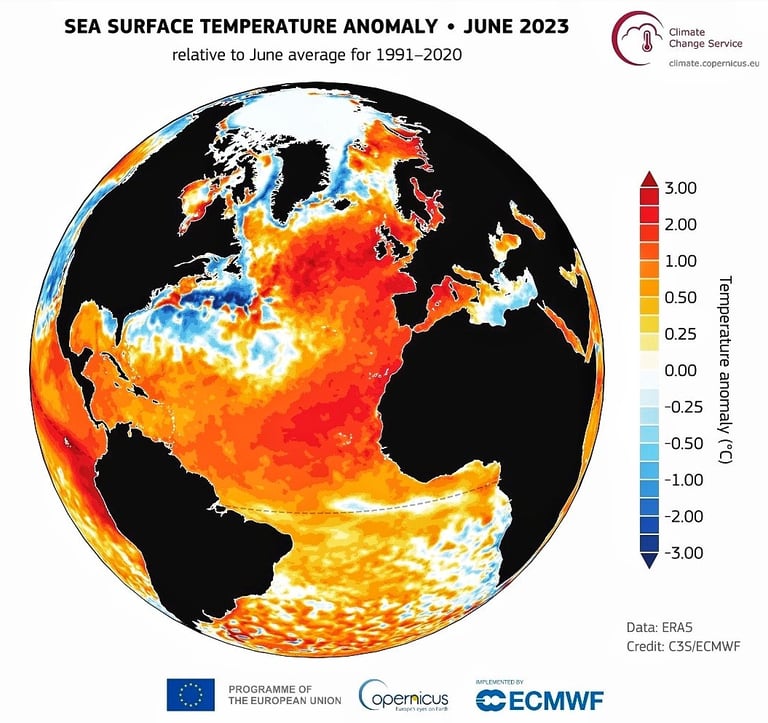
When studying Fig 3, bear in mind the reference value against which the sea surface temperature (SST) is being measured is the 1991-2020 June mean, not pre-industrial, not 1951-80. Climate scientists were anticpating warmer SSTs owing to the developing El Niño in the Pacific Ocean but they were not expecting this:
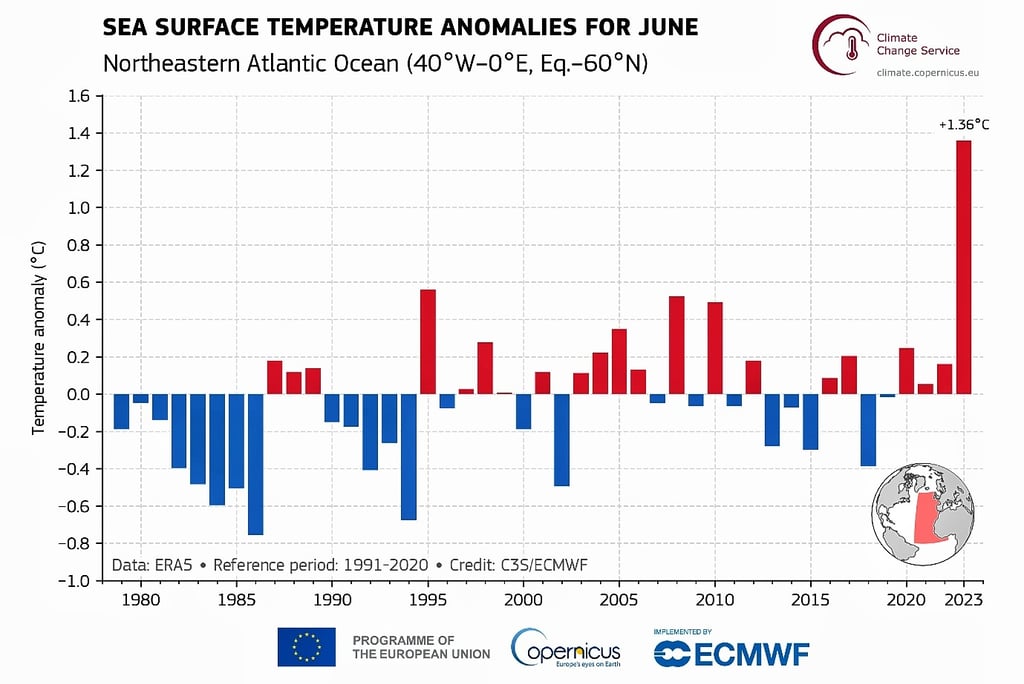
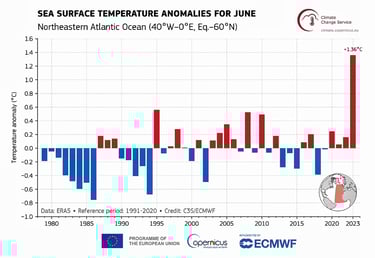
Fig 4
In June 2023, the National Oceanic and Atmospheric Administration (NOAA) issued a category 5 marine heatwave alert (‘Beyond Extreme’ – the highest level) for the Atlantic off the coast of Ireland. Category 4 (‘extreme’) marine heatwave conditions occurred around the rest of Ireland and the U.K., and in the Baltic Sea. What was becoming evident was the pace, magnitude and diversity of impacts that GHGs were having on the climate. In some locations around the UK and Ireland, sea temperatures were 4-5°C above normal.
Now, here’s the thing. If you’ve got this far, you will have read my above statement: ‘It’s no surprise that the land is heating more quickly than the oceans since it has a lower heat capacity, i.e. it’s easier to heat up.’ Let’s turn that round. ‘It’s astounding - no, frightening - that the oceans around the UK in June 2023 heated up more than the land.’ Because to raise the temperature of water requires a colossal amount of heat. 90% of the excess heat generated by man’s activities is absorbed by the oceans causing them to warm very slowly. So raising the surface waters by 4-5°C must have involved astronomic amounts of excess heat. If this continues, scientists are concerned that ocean currents may change course. Ocean currents determine our climate.
But warming is not uniform across the world. Some places are warming far more rapidly than others.
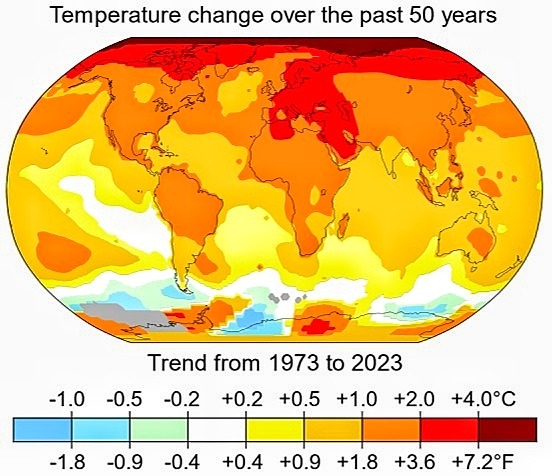
Fig 5
By NASA’s Scientific Visualization Studio, Key and Title by uploader (Eric Fisk) CC BY-SA 4.0,
Fig 5 also reveals the astonishing rate of warming taking place in the Arctic. Recent calculations reveal that the Arctic is warming four times faster than the global average. There is no ecosystem on the planet that can withstand that rate of change. A 4°C rise in Arctic temperature over the past 50 years is proving catastrophic, not only to endemic species – the impact on polar bears is well documented – but also to the Arctic’s human inhabitants. Arctic glaciers and ice caps are melting at an alarming rate accounting for 35% of sea level rise. Permafrost is melting threatening buildings, pipelines and airstrips. Wildfires are surging especially in Alaska and Siberia. Coastlines are eroding without sea ice to protect them.
Finally, a graphic which is becoming increasingly common as a means of emphasising the sheer speed at which global warming is taking place. A spectrum of colours is used to represent the monthly anomalies in successive 20-year periods from 1880 to the 2020’s, using the mean temperature from 1980 – 2015 as a reference (not the usual 1850-1900 ref.). The data here is monthly mean global temperature calculated, as before, from thousands of meteorological stations and ocean ships and buoys.
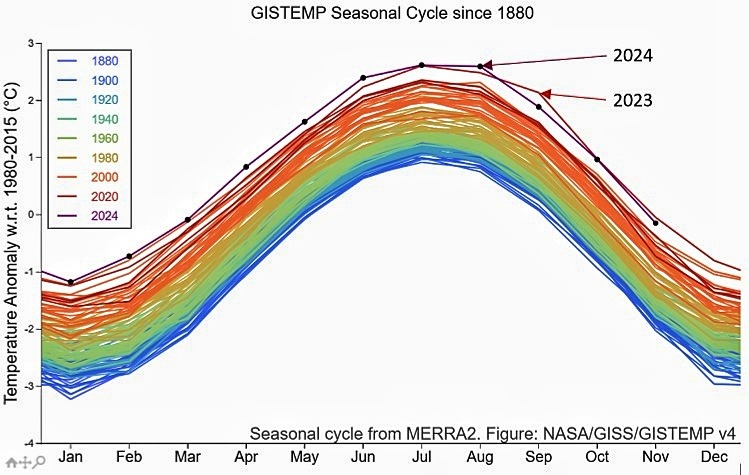
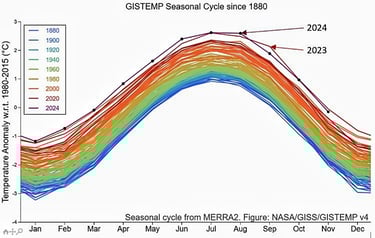
Fig 6
2023 was clearly the warmest year from June through to December. However, 2024 is looking to steal that accolade and become the warmest year ever recorded. [Update: 2024 was the warmest year on record.]
It doesn’t matter which reference figure you take, or whether you measure land or sea temperature, or whether you collect data from the northern or southern hemisphere, the fact is the temperature of Earth’s surface is rising. The rising population puts pressure on electricity demands and transport which increase the consumption of fossil fuels and raise CO2 emissions. Expanding the concrete environment for added infrastructure together with destruction of forest for growing food adds to emissions. The end result – the world is getting warmer. The table showing the 10 warmest years is alarming.
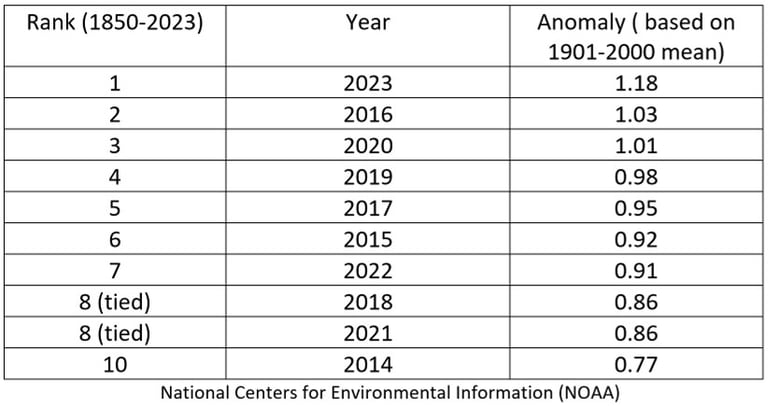
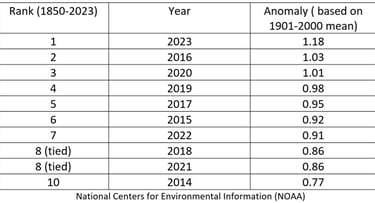
Table 1
Alarming because every one of the last 10 years is in the table. 2023 was exceptional since it topped the table by a whopping 0.15 degrees. The public perception of 0.15°C is, understandably, a tiny increase, scarcely detectable by human skin. The planet’s skin is many times more sensitive and 0.15°C is a huge leap with dire consequences for us and the other 10 million species.
While continued increases in all greenhouse gases was the main factor behind 2023’s record breaking temperature, at the same time, the world was experiencing a medium strength El Niño. This caused the sea surface around the equator in the central and eastern Pacific near South America to become warmer. This acted as a giant heat source in the tropics, which affected atmospheric circulation and acted in concert with man-made warming. The El Niño phenomenon tends to have its greatest effects in its second year and that's exactly what took place. No one, however, could have predicted the margin by which 2024 knocked 2023 into second place. Moreover, January 2025, when the El Niño effect has long since passed, has broken the all-time January temperature record by a huge margin.
I am writing this just 10 years after COP21 in Paris. “I hear no objection in the room, I declare the Paris climate agreement adopted.” It was with these words, on Saturday, 12 December, 2015 that Laurent Fabius closed the fierce negotiations that had been underway for two weeks in Le Bourget, France. A long standing ovation and shouts of joy followed in the room where the 195 countries had gathered to adopt the Paris agreement, a historic agreement to combat climate change.
It should be immediately apparent to anyone studying the data on this page that the world's efforts to limit global temperature rises to 1.5°C have failed in just 10 short years. The section on Predicting Climate Change gives an even more worrying picture of the chances of keeping temperatures below 2.0°C.