R I S I N G S E A L E V E L S
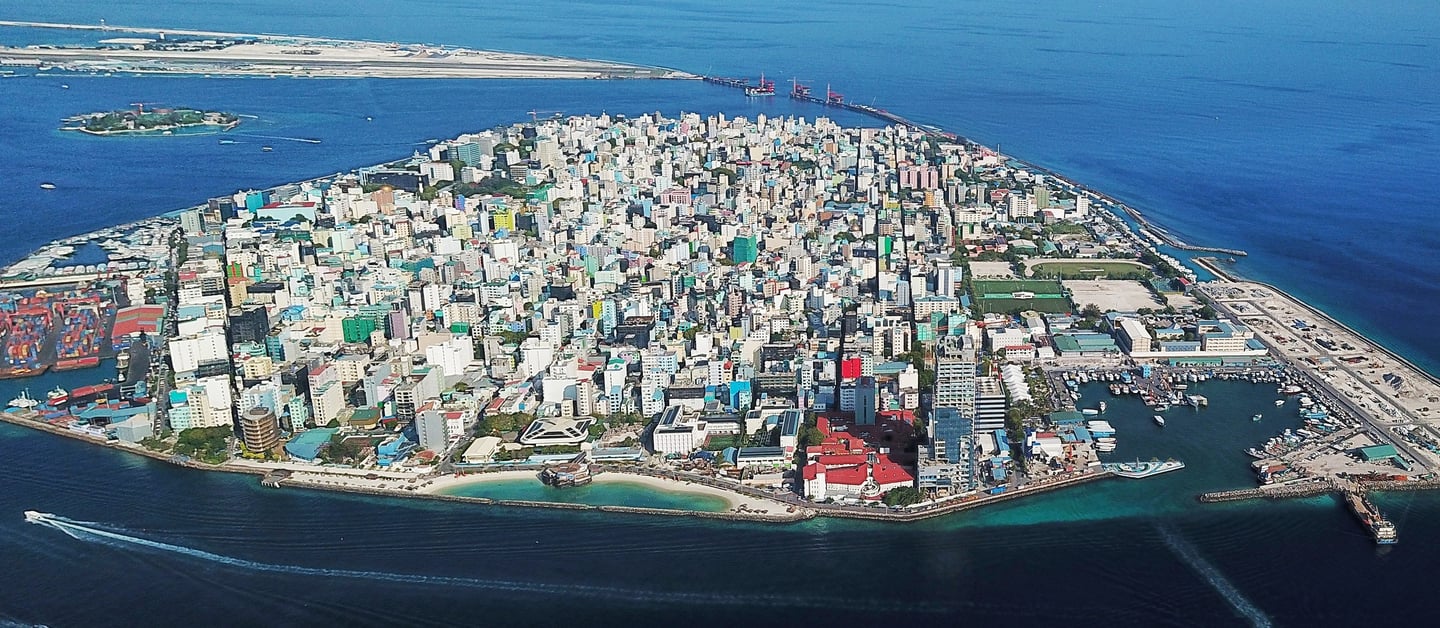
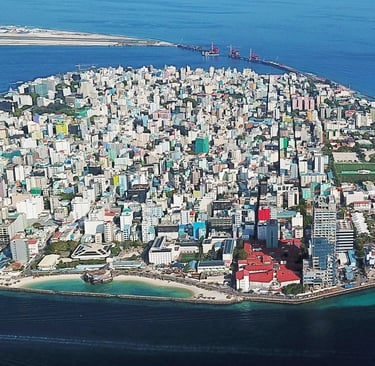
Malé, the capital island of Maldives.
First, a few sobering facts.
Global average sea level has risen over 25 centimeters since 1880. That’s almost 10 inches.
The rate of global sea level rise (SLR) is accelerating: it has more than doubled since the start of the satellite record, increasing from 2.13mm per year between 1993-2002 to 4.77mm per year from 2014 -2023.
Still not sober? That’s because the increases seem negligible; just a few millimeters each year, a change that the human eye cannot detect looking out to sea. So what’s the fuss? After all, in 2024 the President-elect of the USA famously mocked concerns over SLR. “They talk all the time about the ocean will rise in 500 years, one-eighth of an inch. Who the hell cares?” If that was true, I'm not sure anyone would care. But it's not.
Figure 1 below shows global average sea level rise (SLR).
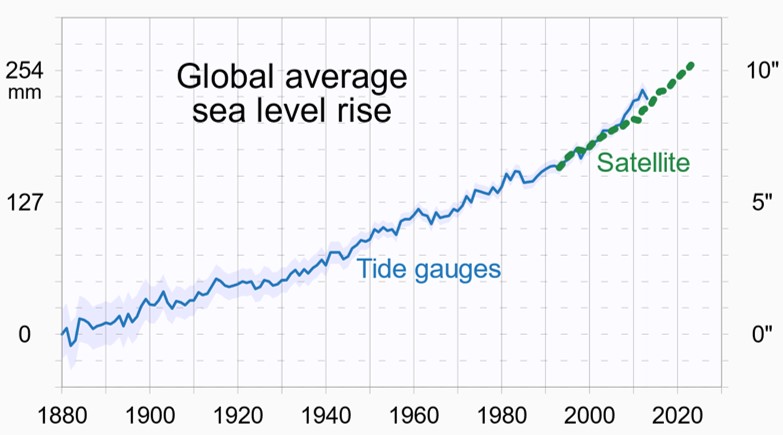
Figure 1
RCraig09, CC BY-SA 4.0
This graph shows cumulative changes in sea level for the world’s oceans since 1880, based on a combination of long-term tide gauge measurements and recent satellite measurements. The shaded band shows the likely range of values, based on the number of measurements collected and the precision of the methods used. What’s immediately apparent is the increase is not constant. Instead, it’s increasing. The curve is becoming steeper. This is also apparent on Figure 2 below which shows recent cumulative changes in average SLR since 1993.
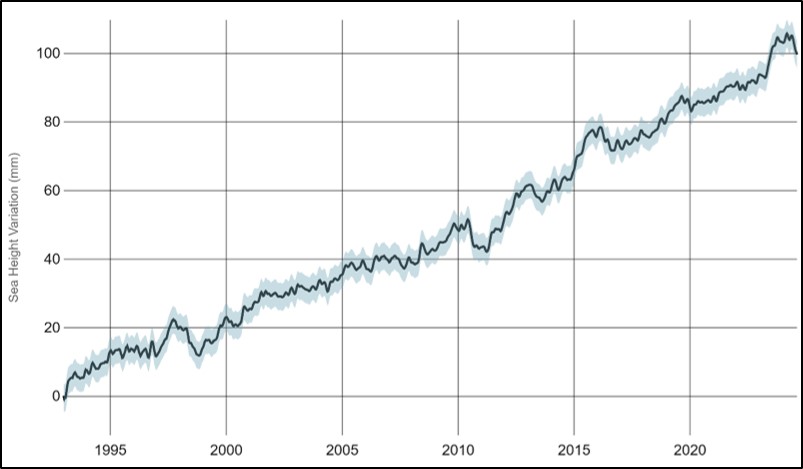
Data source: Satellite sea level observations. Credit: NASA's Goddard Space Flight Center
Figure 2
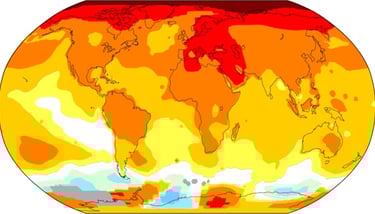
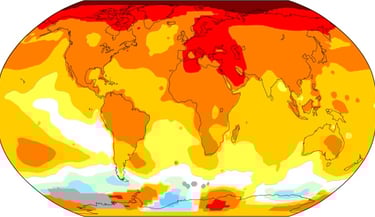
SLR across the world varies widely. Indeed, in the Southern Ocean around Antarctica, in places sea level has fallen. Fig 3 indicates this is a rare phenomenon. Look at those dark blue circles on the margins of some of the world’s continents where sea levels have risen by 15-20 cms in just 30 years. In answer to Mr Trump’s question “Who the hell cares?”, according to the World Economic Forum, 410 million people could be at risk from SLR by the end of this century. They will certainly care.

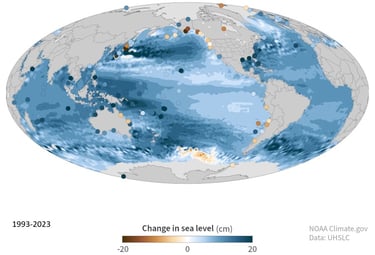
Map by NOAA Climate.gov based on data provided by Philip Thompson, University of Hawaii.
Figure 3
There are already major cities around the world which are experiencing increased risk of flooding. Bangkok has an average elevation of just 1.5 meters above sea level. The clay on which the city is built needs a healthy supply of groundwater to retain its supportive qualities. Bangkok’s rain, however, can no longer reach the clay owing to the city’s vast concrete sprawl. As a result, the city is sinking by around 1-2 cm each year. Then there is SLR, currently 4mm a year. According to World Bank forecasts, 40% of Bangkok could be submerged by 2030.
Other cities such as Venice and New Orleans are facing similar challenges exacerbated by SLR. But perhaps the currently worst affected regions of the world are the Pacific islands, some of which face complete inundation by the sea before 2100. The Kiribati islands, home to some 115,000 people are facing increased frequency of storm surges, contaminated freshwater, flooding of homes, and crop destruction. Likewise Tuvalu, the Marshall Islands, the Federated States of Micronesia and the Solomon Islands. There are many others. The future for these islands looks very grim.
Sea levels are rising. But what is the source of billions of cubic meters of freshwater entering the oceans each year?
Check out this map of Greenland. It’s worth a moment’s study.
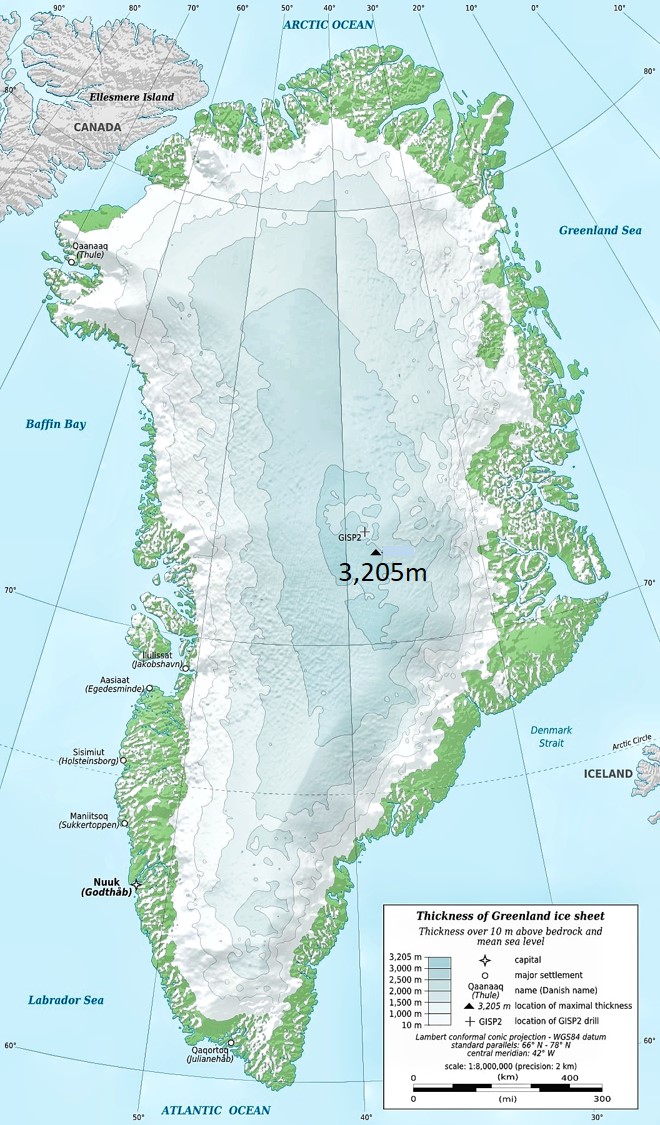
Figure 4
There is only one spot height marked on the map – the highest point in Greenland, 3,205m. That’s 10,515ft. Stand here if you will and drill down through the ice sheet. Keep drilling until you hit rock. You’ll need a drill 3 kilometers in length (1.9 miles). The ice sheet covers 1.7 million square kilometers, 80 percent of the world's largest island. It’s mind-bogglingly big and it’s melting mind-bogglingly quickly.
There is a consensus amongst scientists that the Greenland Ice Sheet is losing mass at a pace of on average 200 billion tonnes of ice per year. That’s roughly 200 cubic kilometers of ice, a quantity we cannot begin to imagine. Maybe 1,200 elephants charging into the ocean every second of the year? 10 olympic-sized swimming pools every second? Nope. The scale of melt is just too large to grasp.
2024 will be the 28th consecutive year of Greenland ice melt.
At the other end of the planet, the West Antarctic Ice Sheet is also melting rapidly though not as fast as Greenland’s. Confusingly, other parts are growing due to unusually large snowfalls caused by disruptions in the climate. However surveys of the entire ice sheet show that overall, ice loss is eclipsing new snowfall. The West Antarctic Ice Sheet is in decline and has been for decades. Each year, the ice sheet is shrinking more rapidly. By 2020, the speed of ice loss in Antarctica had multiplied sixfold over thirty years reaching around 148 billion tonnes per year. The full picture of ice melt in Antarctica, however, is still not clear and the extent of its contribution to rising sea levels is a matter of considerable debate.
Currently, total sea level rise is about 4.5 millimeters per year. Of that amount, only about one-third comes from Greenland and Antarctica. Around 21% comes from melting glaciers. In a quite remarkable study on global glacier mass loss in the early twenty-first century, the authors found that glaciers are currently losing more mass than either the Greenland or Antarctic ice sheets and annual rates of glacier thinning “nearly doubled” between 2000 and 2019. The study calculated that over this period, glaciers collectively lost around 267 billion tonnes of ice every year. Assuming that all the water from melting glaciers eventually reaches the ocean, this means that meltwater from glaciers alone contributed 0.74mm of sea level rise every year.
Iconic photos of glaciers taken many years apart send a powerful message about the impact of global warming. The photos below were taken at roughly the same place (compare the mountain skylines) in front of the Pedersen Glacier (or what's left of it), at Aialik Bay in Alaska’s Kenai Mountains in 1917 and 2005.
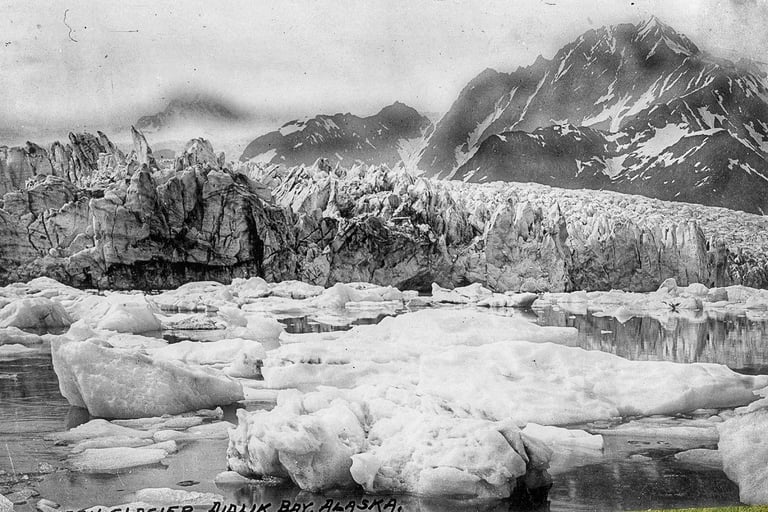
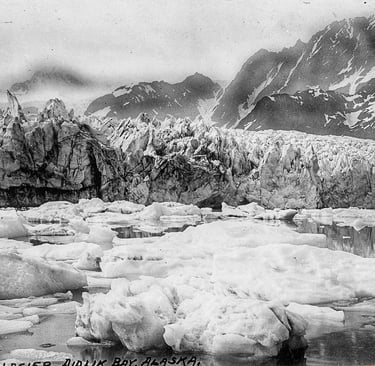
Photos courtesy of Louis H. Pedersen (1917) and Bruce F. Molina (2005), obtained from the Glacier Photograph Collection, Boulder, Colorado USA: National Snow and Ice Data Center/World Data Center for Glaciology.
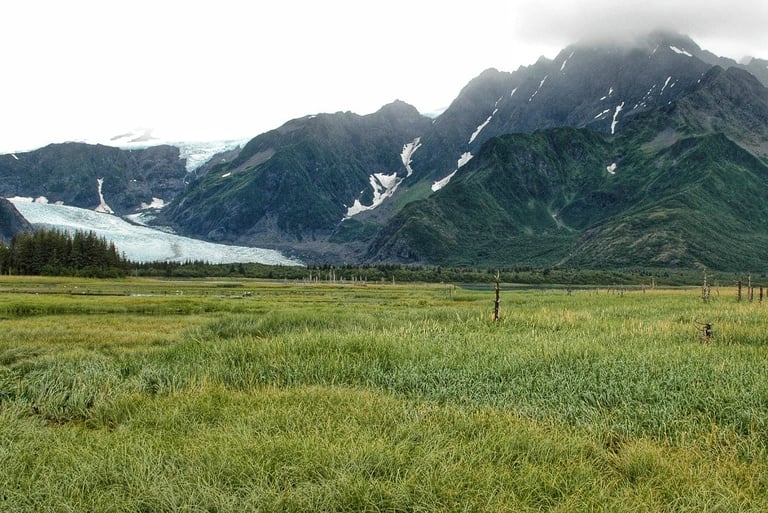
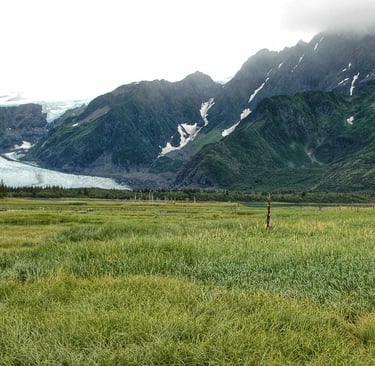
Figures 5 + 6
For me, it’s the middle right-hand distance that is truly shocking where the colossal river of ice in 1917 has completely vanished.
Melting glaciers don’t just add to sea level rise. They are a vital source of fresh water for communities living downstream, both for drinking and crops irrigation. The meltwater would appear in the short term to provide for these needs but once the ice has melted, the life-giving streams and rivers will dry up.
The rate of SLR cannot be explained solely by the melting of land-based ice – that is, ice sheets and glaciers. Something else is contributing massively to SLR. Melting sea ice does not cause sea level rise since it sits in the oceans displacing its own volume. When it melts, it takes up roughly the same volume as it displaced. The disappearance of Arctic and Antarctic sea ice is covered therefore in a separate section.
The answer is the thermal expansion of water. We know that the mean temperature of the surface waters of the world’s oceans has increased by approximately 0.13°C per decade over the past 100 years. Doesn’t sound like much but around half of the SLR is believed to be a result of the thermal expansion of the oceans. As the atmosphere continues to warm, so surface waters will continue to warm and expand. More than 90 percent of the excess heat trapped in the Earth system due to human-caused global warming has been absorbed by the oceans simply because water has a much higher heat capacity than land.
There’s another fly in the ointment, however. Sea level rise lags behind changes in the Earth's temperature by many decades, and SLR will therefore continue to accelerate between now and 2050 in response to warming that has already happened. What happens thereafter depends entirely on GHG emissions. If there are immediate deep cuts in emissions, then by 2100, SLR could be limited to around 30 additional cms from now.
Tipping points.
Courtney Lindwall wrote an excellent article on tipping points for the NRDC (the Natural Resources Defense Council) and I quote her opening paragraphs since I cannot better them:
“We often think of global warming as being linear: Emit too much carbon and the planet’s thermostat goes up proportionally. And, while this is generally true, the resulting climate consequences—like severe drought—don’t necessarily follow that track. In other words, 10 percent more CO2 doesn't just equal 10 percent more impact.
The Greenland Icecap is a perfect example of a natural system that is in the process of reaching a melting tipping point. With atmospheric warming of the Arctic – it’s around 3°C warmer than it was in 1980 – Greenland’s ice is melting rapidly. The amount of melting at its surface exceeds the rate of winter snow accumulation. As a result, its surface is lowering, revealing darker ice below. Darker ice absorbs more of the sun’s heat. This will quicken the pace of melting. Melting also reduces the ice sheet’s height, so that more of its surface is affected by warmer air at lower altitudes. The faster melting occurs, the faster melting will occur. The downward spiral is irreversible. No amount of emission curbs will stop it once it starts.
Prior research puts the required temperature rise around Greenland for this threshold to be be passed at around 4.5°C above pre-industrial levels. The Arctic will reach that temperature before 2050 if current carbon missions are not drastically curbed.
The more complex reality is that the cumulative effects of continued greenhouse gas emissions could potentially trigger what scientists refer to as climate tipping points. These are critical thresholds that, once crossed, tip a natural system into an entirely different state and lead to potentially irreversible, catastrophic impacts for the planet—including more warming.”
UPDATE: The UN's Climate Action report 'Surging seas in a warming world' includes the current best predictions of sea level rise from 2020 to 2050.
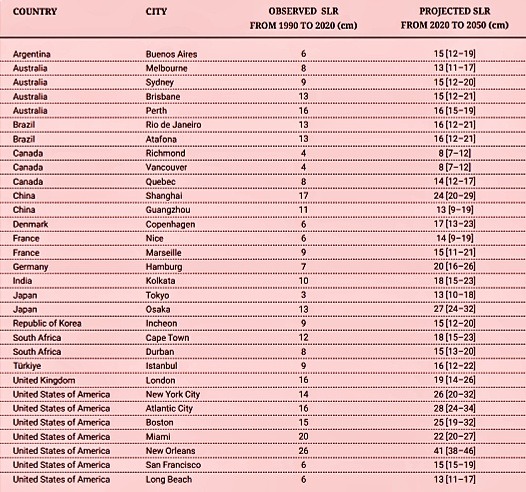
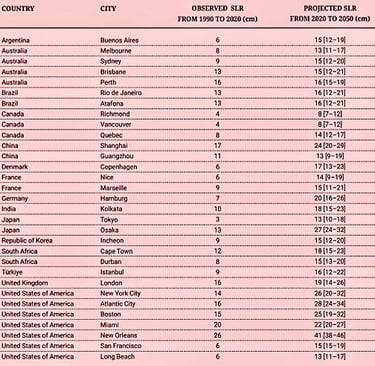
The cities most at immediate risk are those on the east coast of America with New Orleans facing a projected rise of 41cm; that's 16 inches! This is a colossal rise and stands in stark contrast to Donald Trump's claim on the campaign trail in August 2024 that sea level would only rise one-eighth of an inch over the next 400 years. He is wrong by a factor of 1,700. This is a staggering error from the President of a country facing some of the worst effects of climate change in the world.